Rather than doing “real” work, I’ve found myself digging through initial election results data. Yeah, I’m a geek. I could do this all day. All night. Whatever. However, I thought I’d best share a snapshot of what I have and try to move on for now.
As every political commentator has constantly noted, a lot more people voted this year than is normal for a mid-term election. Nationwide, 49.2% of eligible voters cast ballots earlier this month. Yeah, okay. While I personally don’t find a cause for celebration in the fact that half of the electorate couldn’t bother to vote, I guess I should be happy with the improvement from the 36.7% turnout in 2014.
Beyond the raw voter totals, however, there’s really not a whole lot that we know for sure quite yet. Despite a ton of pundits citing mid-term voter breakdowns to make various prognostications, the numbers we have are based on very preliminary data – and those numbers are open to interpretation. That, of course, didn’t stop me from taking a peek.
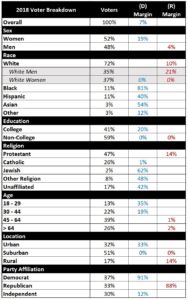
I cobbled together my current take from numerous sources, each with their own issues. As such, I suggest that no one look too hard at the exact numbers since some things won’t quite add up. In an attempt to compare apples-to-apples, I did try to only consider available data in U.S. House races – since all voters had an opportunity to vote in exactly one of those races. Of course, candidates really do matter and the breakdowns are thus not necessarily indicative of any generic preference. However, this is what we have. Consider this an extremely rough first take of a very broad (D) vs. (R) voter profile for 2018:

In brief:
- Men favored Republicans but more women voted and they favored Democrats by a wider margin.
- White voters outnumbered non-white voters and they favored Republicans, but non-white voters favored Democrats by much wider margins.
- White men went heavily Republican but white women were evenly split.
- College-educated voters favored Democrats and the parties split the rest.
- Protestants favored Republicans but non-Protestants favored Democrats by wider margins.
- Older voters outnumbered younger voters and they favored Republicans, but younger voters favored Democrats by much wider margins.
- Democrats took the cities, Republicans took the country, and the parties split the suburbs.
- Self-identified independents favored Democrats.
Got all that? Now forget it. While the above is certainly fascinating (at least to me), it’s just not as enlightening as you might expect going forward.
Yes, the above data is minimally useful to derive early projections with respect to the 2020 House races. The current numbers look decent for Democrats and it’s always easier to defend a majority than to build one. However, the dynamics of a concurrent 2020 Presidential election will most certainly have a huge impact that is as yet unknown. Also, the up-ticket Senate and Governor races will be quite different in 2020 than they were this year.
In the Senate, it’ll be a brand new game with a different set of 33 seats on the table – 21 held by Republicans and 12 held by Democrats. At least one reasonable scenario has the Democrats flipping just enough net seats to split the Senate 50-50. In that case, with the VP potentially casting decisive Senate votes, the 2020 Presidential election becomes even more important – if that’s even possible.
And so. Everything comes down to the 2020 Presidential election. That election, of course, will be decided solely by Electoral College votes. Given that most states allocate all of their electors to the victor in their state, overall popular vote totals don’t matter and state-level margins don’t matter. State wins and state elector counts are the whole game. Thus, Democrats need to look at voter profiles and turnout rates for each state completely independent of the others. The above national analysis needs to be considered separately for every in-play state, state-level trends need to be estimated, state-level outreach strategies need to be defined, candidates need to be evaluated using state-based metrics, and, somehow, a Democratic ticket needs to be formed that can piece together a 50%+1 majority in enough states to get at least 270 electoral votes. My head hurts.
Whether or not the Electoral College is still a good idea might well be the topic of a future blog post. (Spoiler Alert: It’s not a good idea.) However, for now, we have to assume the rules we have. At some point in the hopefully near future, I’ll take an early look at the 2020 Electoral College map along with some Democratic ticket options.
Sure, the 2020 elections are two years away. But there’s a whole lot of work to do and the time to start is now. Break’s over.